Along with your marketing KPIs and financial metrics, sales performance indicators are essential metrics for you to effectively monitor the success of your SaaS business.
Beyond helping you stay on top of your overall business performance, they can help you leverage your most productive assets as well as identify issues in the sales process before they can have any negative impact on your company’s growth.
Sales performance metrics can also help you manage your sales team. They are typically available in your CRM and are laser-focused on your sales force efficiency.
Putting those indicators together in intuitive, dynamic, sales dashboards provides at-your-fingertips ease to view, monitor, drill down, understand, and share data to elevate the performance of your teams.
When it comes to SaaS companies, certain KPIs are especially valuable to keep sales moving forward efficiently and are singularly fitting for sales dashboards. However, it often doesn’t take long to get submerged by all the different SaaS KPIs available to you!
So, here are the ones we recommend:
Key Sales KPIs for SaaS Companies
Whether you are a SaaS start-up in the early stages of launch, or you’re a software editor newly transitioning to the SaaS model, you need a set of indicators to help you scrutinize each stage of your development.
They will help you determine how well your product performs as well as inform you about the quality of your customer relationships.
KPI #1: Booking Volume
Quantifying your appeal
Your booking volume is the number of orders that were taken when you opened and the number that you’ve completed so far.
From the beginning, as you start to take orders and acquire your first customers, you can begin to formulate metrics to monitor your progress.
The metric helps you determine the appeal of your offer to businesses, and to know if the methods such as inbound lead generation, outreach, ads, PPL, etc. you’re using have been effective.
Maybe you’ve offered a freemium or a test version. Whatever your strategy, the important thing is to clearly differentiate the software subscription from your other offerings.
The software subscription is what you want to base your analysis on. Associated services—setup, advice, integration, for example—can be measured separately.
KPI #2: The Monthly Recurring Revenue (MRR)
Evaluating long-term sales
The MRR is the principal indicator for subscription systems, such as those used by companies with a SaaS business model, and is a fundamental KPI for the valuation of a SaaS software editor.
Since it reflects the income that you can count on receiving every month, it gives you a view of your sales over the long term. To come up with the MRR, first calculate the amount that your customers pay over a month, whether they pay monthly or per annual subscription. Then multiply your total number of paying users by the average revenue per user.
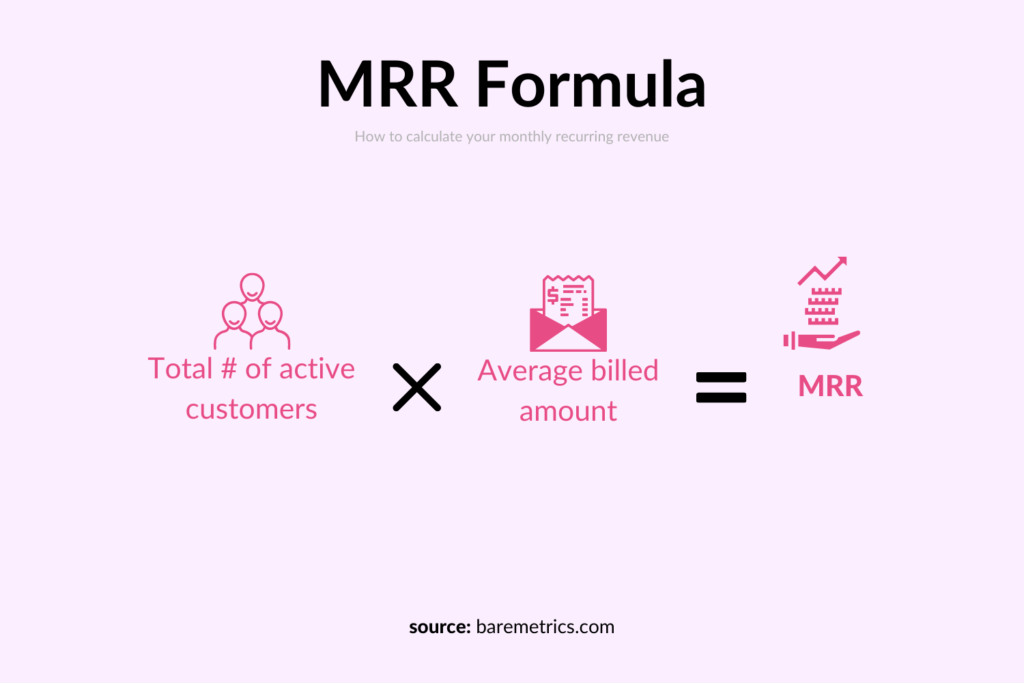
The MRR will correspond to your monthly recurring turnover—the monthly income directly related to the use of the software by your customers under paid subscriptions.
How much your MRR grows will depend on several factors: the number of new subscribers, the number of unsubscribers, or customer churn, and your upsells to satisfied customers who are willing to pay more to get wider or more in-depth service.
Ideally, in the speed-to-market phase, you should aim for an MRR growth rate of at least 15% per month, according to experts. Then aim for a higher rate each year.
KPI #3: The Churn
Getting a grasp of your growth rate
Your churn rate is an essential indicator for measuring the performance of your customer relationships. The churn is the opposite of your retention rate, i.e., the number of existing customers that you manage to retain, and is basically your attrition rate.
A poor churn, in other words, a high rate of churn, indicates factors are working against your sales. And if it occurs suddenly, you need to analyze it even more to understand the disaffection of your B2B customers.
To calculate churn, divide the number of unsubscribes by the total number of subscribers. Aim for a maximum churn of 2 to 5% per month.
There are two types of churn: “customer” churn and “revenue” churn. Each of them provides a different perspective on the health of your SaaS business:
- Customer churn is the percentage of customers who terminated their subscription at the end of a given period. Simply put it’s the number of people you’ve lost.
- Revenue churn represents the percentage of total recurring revenue lost due to customer churn. In other words, the amount of revenue you’ve lost.
If your customer churn equals your acquisition rate, then your number of new customers exactly compensates for the number of departures. At that rate, though, growth will slow down and eventually stop.
The more we recognize the relevance of churn to forecasting growth over the years, the more customer renewal will increase in priority for the company.
Remember that, in the long run, keeping existing customers and growing orders from them costs less than finding and converting new customers.
This explains the importance of sales, marketing, and customer support functions within SaaS editors and their tendency to devote more and more resources to them.
Assaf Cohen, who runs the gaming platform Solitaire Bliss, points out the importance of looking at inactive subscribers as an indicator of churn. “We look at what we call sleeping dogs, or users who are subscribing that are no longer playing our solitaire games. This is tightly correlated with our churn rate. Any SaaS business should think about how to re-engage those users to improve their churn rate.”
KPI #4: Visitor and Lead Conversion Rates
Converting visitors into leads and leads into customers
The people who stop and look around your website are visitors; they only become leads when they provide their contact details and start interacting with you. This can involve a variety of inbound marketing techniques, such as downloading a white paper, participating in a webinar, free trial, and more.
- If you get 100 leads out of 3000 visits per month, your visitor/lead conversion rate is 3.3%.
- If out of those 100 leads, 10 become customers, and your lead/customer conversion rate is then 10%.
- And your visitor/customer rate is 0.33%.
Whereas marketing is usually in charge of the first conversion rate (visitors into leads), the sales team is responsible for optimizing the second conversion rate (leads into customers). That means that sales activities must be defined to facilitate conversions, including calls, emails, and other follow-ups.
To keep improving these rates, you need to understand your acquisition funnel in detail. For example, a classic tunnel might consist of your potential customer:
- Visiting your landing page or website
- Registering for the service during a trial period or requesting an appointment
- Engaging in the service or product during the test phase
- Becoming a subscriber to your SaaS model
- Encouraging others to visit the website and championing your service or product
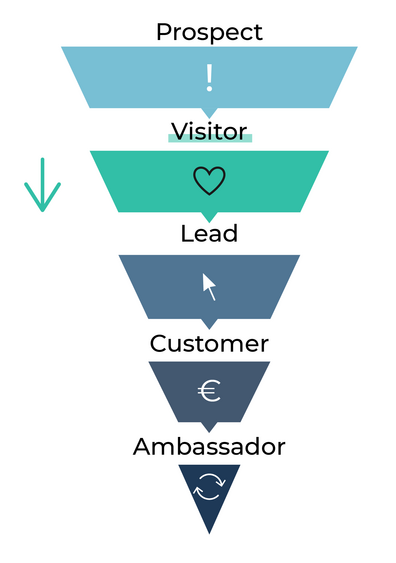
All these steps can and must be improved through tests and actions. The goal is to lose the fewest number of people anywhere along the acquisition funnel.
KPI #5: Average Sales Cycle Duration – in months
Reducing the timeline to close
The sales cycle is the timeline that begins with the creation of the lead and ends with the purchase or closing of the sale. On average, how much time elapses between the company becoming interested in your SaaS solution, the first contacts, the possible quote, and the subscription?
Not surprisingly, the time it takes from the beginning of that cycle to its end determines the effectiveness of your sales effort and productivity. The shorter the time period, the more productive and the more profitable it becomes.
To improve your average sales cycle duration, you need to be able to reduce your prospect’s thinking time.
For example, you can develop workflows for your campaigns with a lead-nurturing objective to mature your leads. The key is to use scoring methods to help detect the hottest leads so that your salespeople can contact them in a timely manner.
KPI #6: Customer Effort Score (CES)
The effort invested by the customer
This metric allows you to measure the energy that your prospect has to invest in order to fulfill an action pertaining to the offer—for example, a purchase, modification of the contract, contact of the after-sales service, and so on.
In other words, it’s the energy they need to provide to be satisfied. It’s your job, then, to reduce this effort as much as possible and to check whether the processes involved are suitable.
For example, perhaps you need to reduce the number of clicks, steps, documents to provide, or software to download, in order for them to achieve the result they’re after.
KPI #7: Lifetime Value (LTV)
The lifetime value of your customers
This metric is the total worth to your business of a customer over the whole period of your relationship:
LTV = Customer Revenue – Costs of Acquiring and Serving the Customer
If a customer has spent $40 every month on your website for the last 10 months, its CLV has been worth $400 to your business.
Instead of analyzing your past data, which is difficult to do if you have just started your business, you have an accurate projection of the future of your business. You can even know when a subscriber will earn you money.
But beware: this method of calculation has some limitations.
For one, it does not take into account the risks related to the market environment, such as competition.
Also, if you have a variety of pricing structures, it will not take into account the fact that a customer wishes to update their subscription and vice versa.
The standard rule for LTV is that it must be equal to or greater than three times your customer acquisition cost (CAC).
On the other hand, if the LTV is close to or less than the CAC, you must seriously worry, since the amount spent to acquire a new customer is more than what that customer is likely to earn in the margin.
Several explanations are possible:
- Your solution is not priced high enough,
- Your customers are not loyal (i.e., your churn is too high) and they leave before they have consumed enough, and/or
- Your customer acquisition costs are too high.
If you are hoping to keep an eye on these metrics, a sales dashboard can go a long way, allowing you to pull the information from your disparate sales applications and display data, metrics, and indicators in ways that communicate action, direction, and results clearly to your teams.
What Else?
Depending on how you organize your sales team and the sales roles that you’ve put in place, you may want to take advantage of the SaaS KPIs, available in your CRM system, that are focused on salesforce management:
- No. Calls Per Day. You’ll find that most sales reps have an objective of daily #dials. Tracking this metric will help your sales director make sure that the sales capacity is right.
- Conversion to Demo. This indicator will oppose the #of demos generated by a rep against the number of leads that reached them. If there are discrepancies between your sales reps, it may be time for some sharing of best practices, everything else being equal.
- Conversion to Deal. This indicator can be calculated with the #of signatures over the #leads. This can give some information about the quality of the sales process as well as the quality of the leads.
As mentioned above, selling is not always about chasing new deals. You can grow your MRR by keeping your current customer onboard and satisfied and by making sure that they continue to expand their use of your services.
You will also like
Helping thousands of data-driven companies
Every day we publish thousands of dashboards, process billions of rows, store terabytes of data for companies just like yours.
