SALES DASHBOARDS
View our selection of Sales dashboard examples.
Click on the dashboard image to see them live.
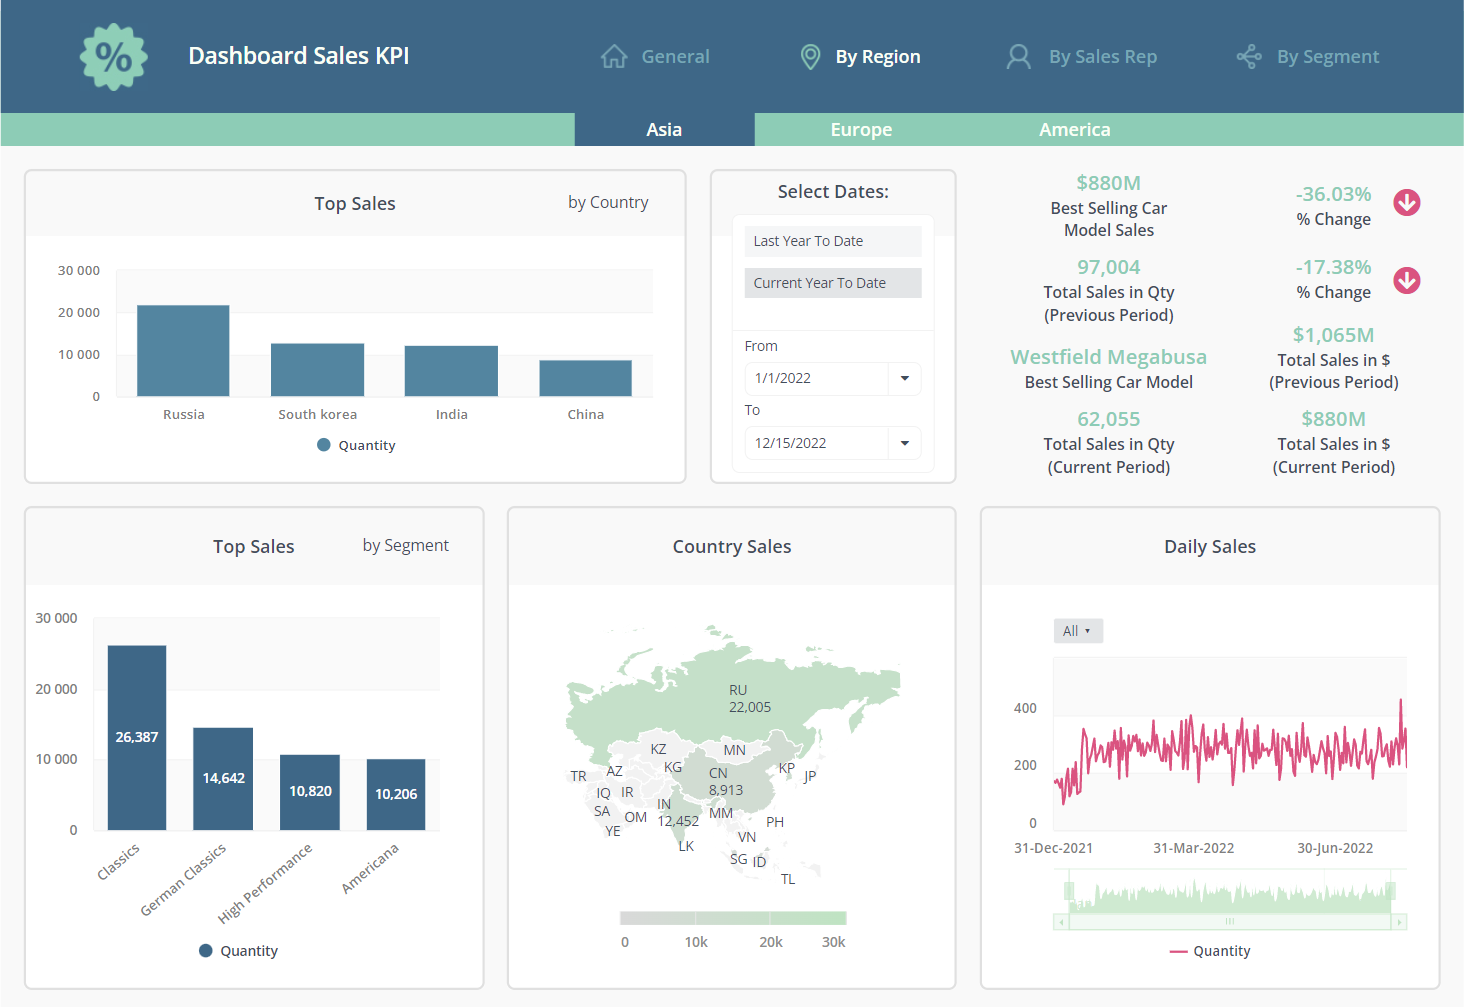
Sales Forecast
A real-time dashboard for sales leaders and executives who want to stay informed and up-to-date on sales forecasts and revenue commitments. Easily combine data from any system to create a single version of the truth. Stop relying on ever changing spreadsheets.
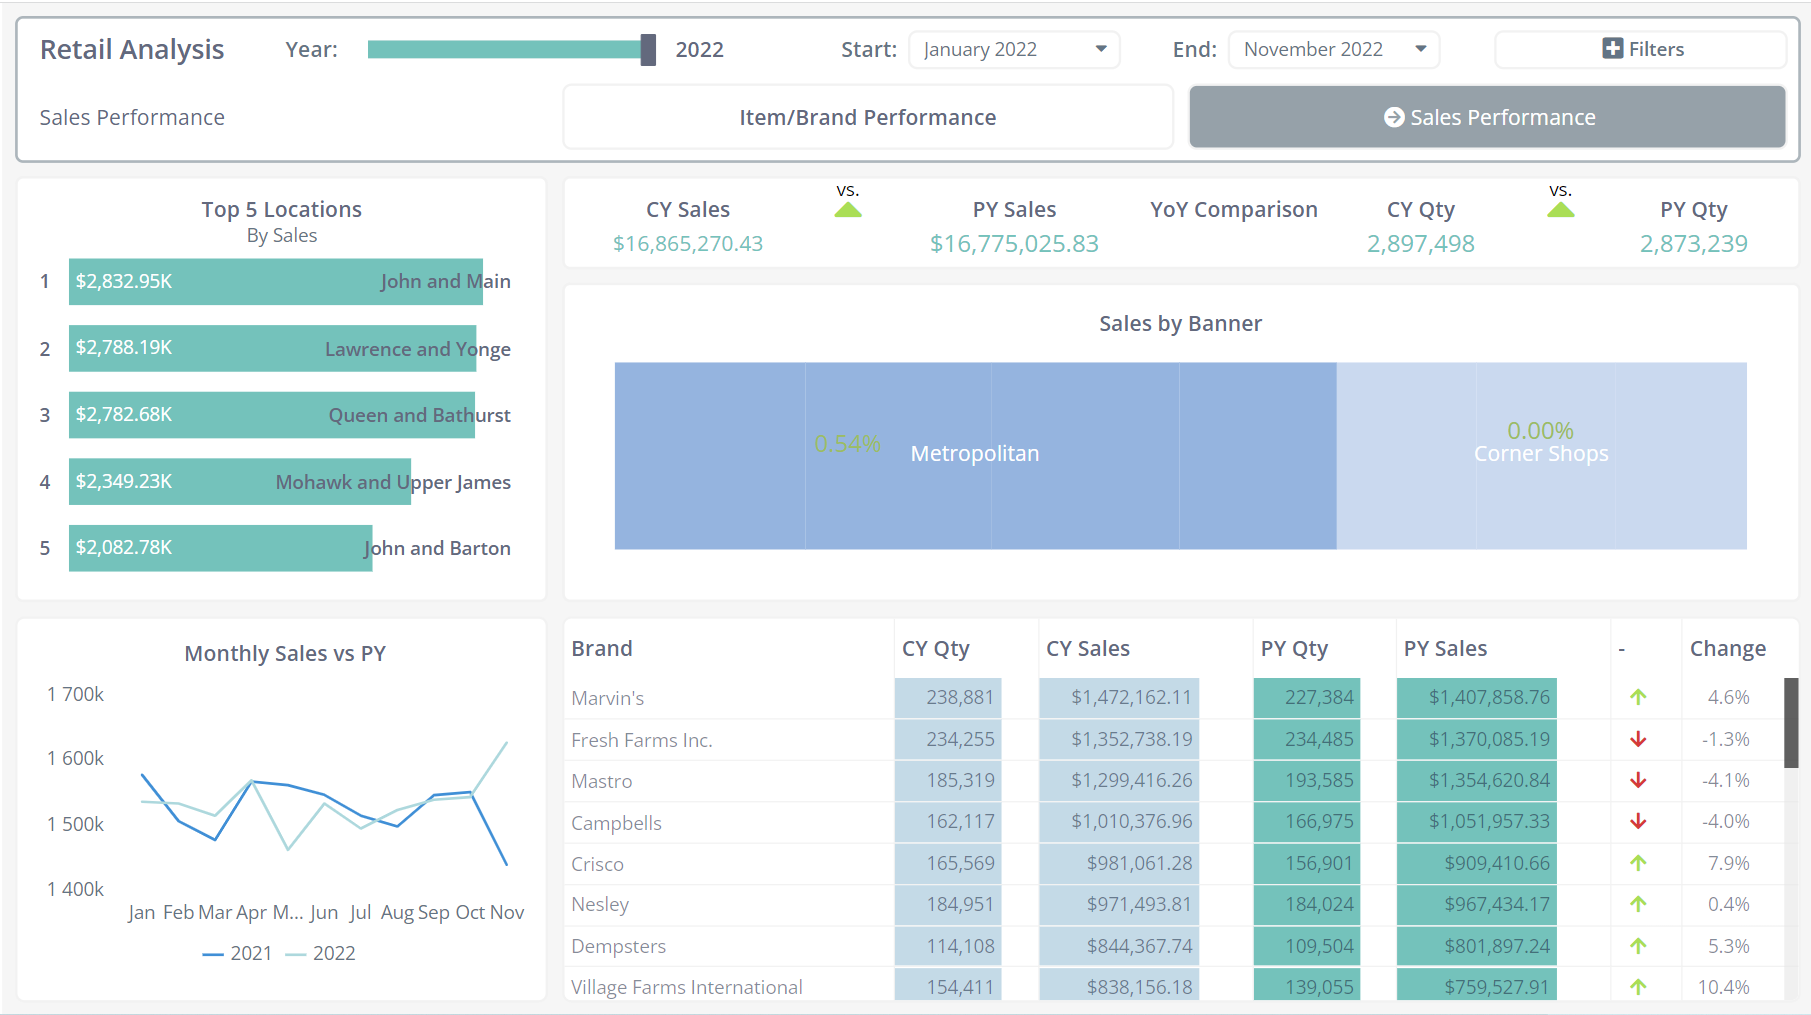
Revenue by Category
Understand which products or services are selling the fastest or which geography is growing faster than expected. Anytime you wish, have the ability to compare and combine any category element to understand where attention is needed.
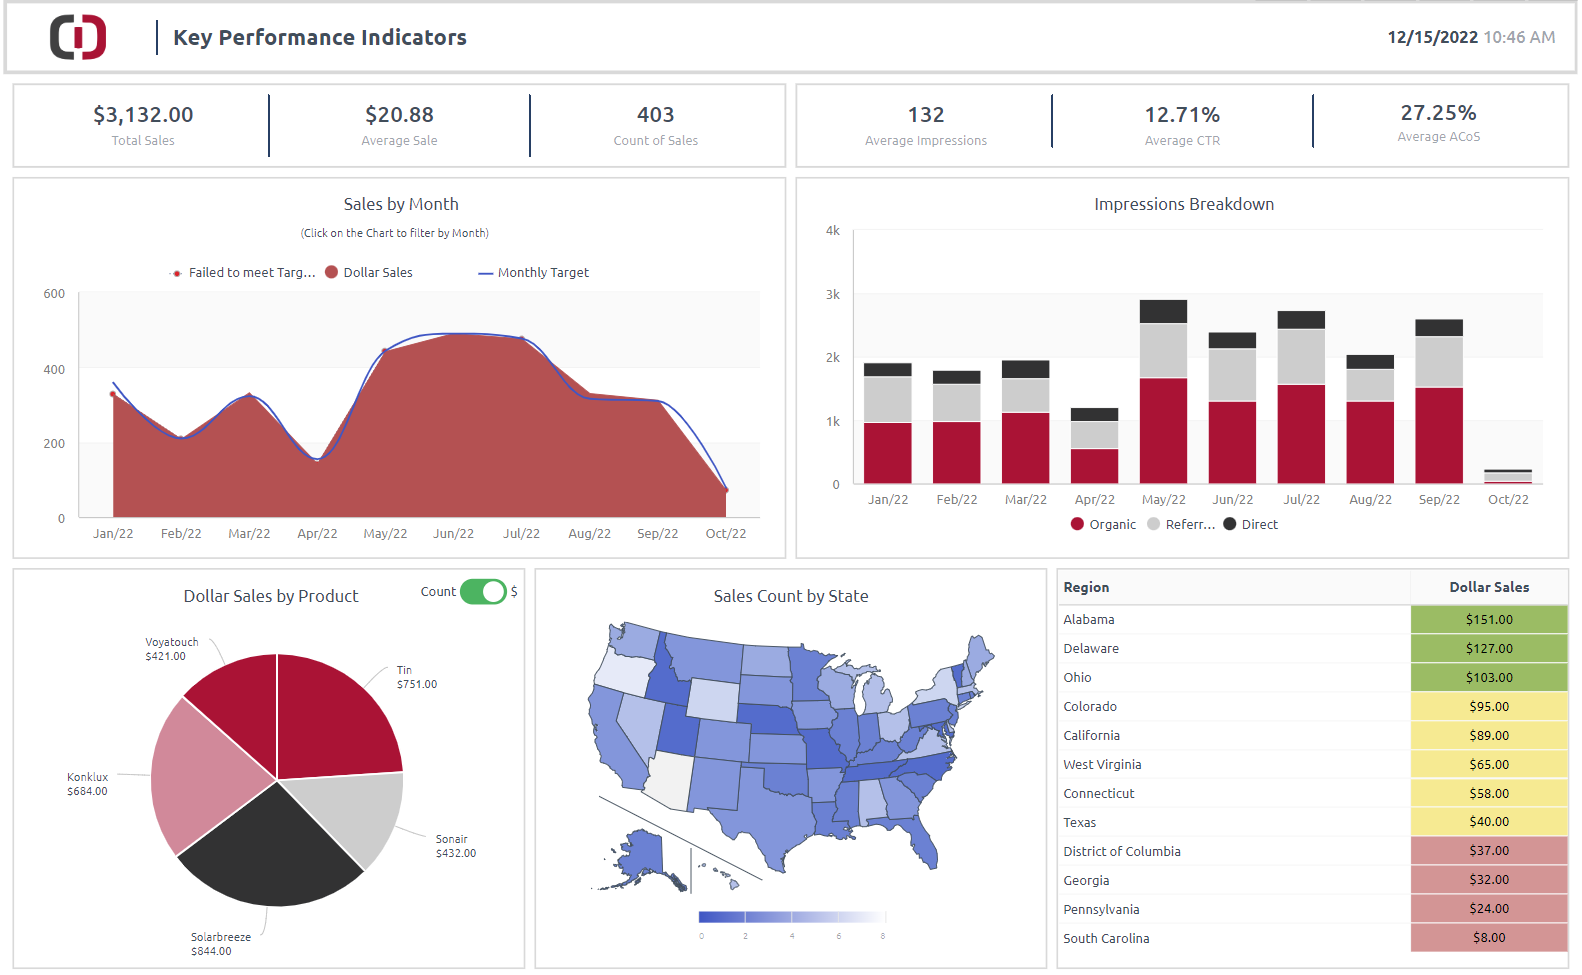
Key Performance Indicators (KPI)
Stay on top of what’s key to driving your business. Customer satisfaction, sales appointments, sales cycle, demos, and so much more. Your KPIs are only of value when they are measured and reported on. Real-time updates are easily available and at your fingertips.
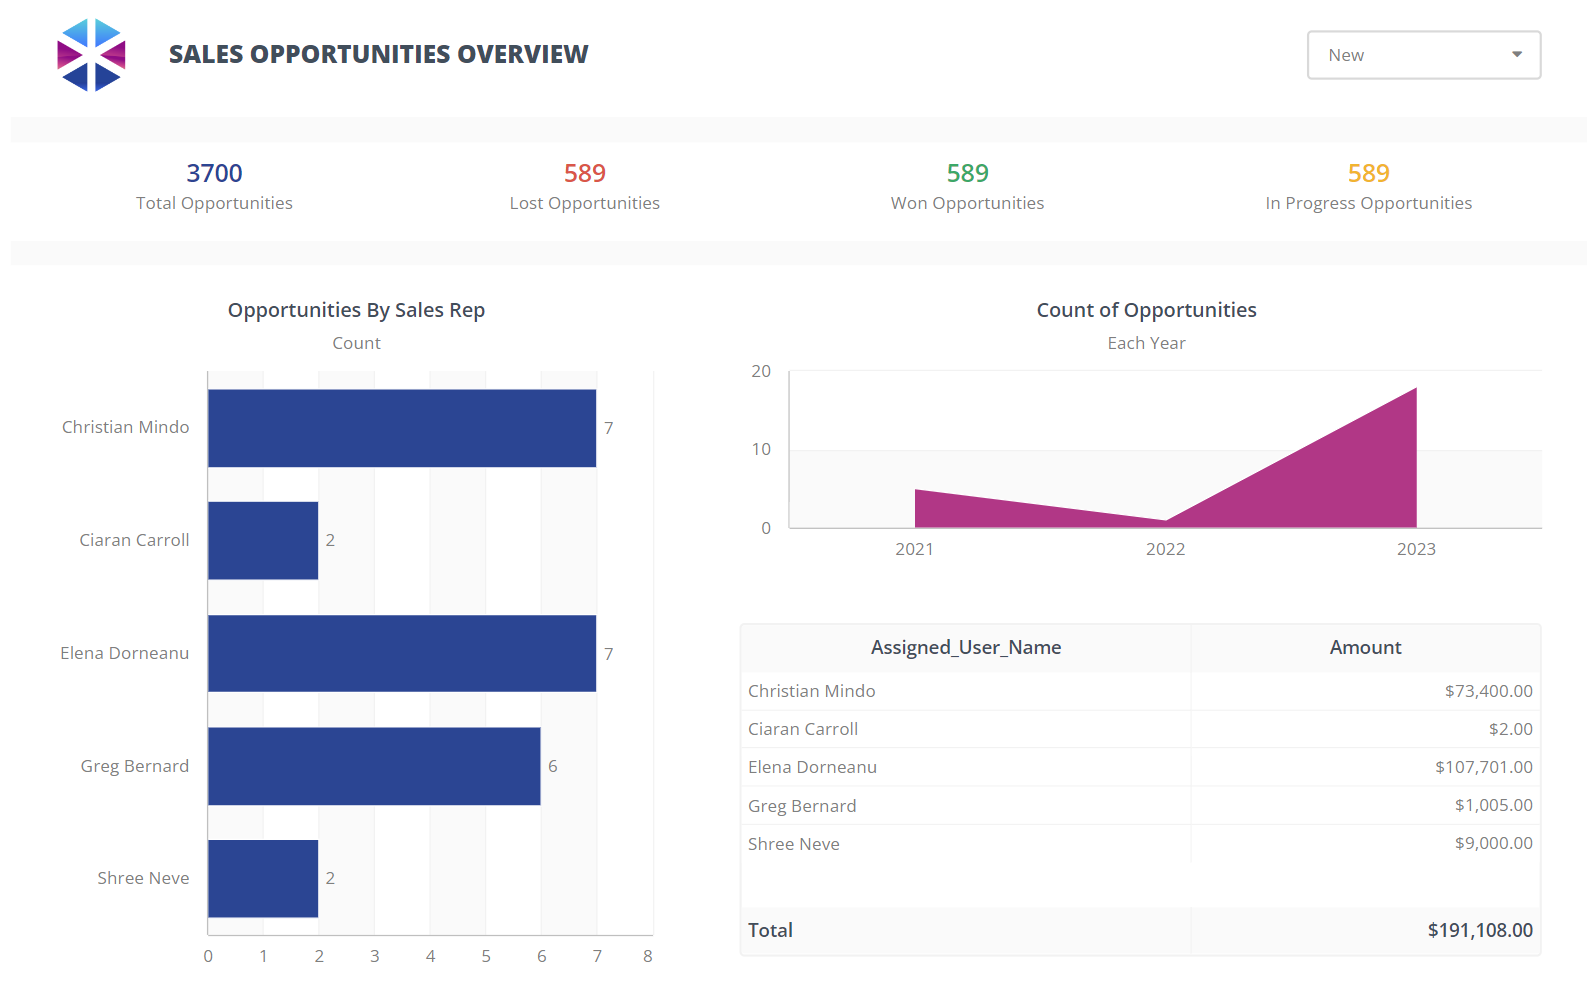
Sales opportunities overview
Tracking Sales Opportunities.
With ClicData, you can easily pull what is needed from your CRM, shared Excel or Google Sheets, and any other location where sales team log and update sales progress. Track leads from MQL to SQL to opportunity to forecasted deal to close, all from a single view.
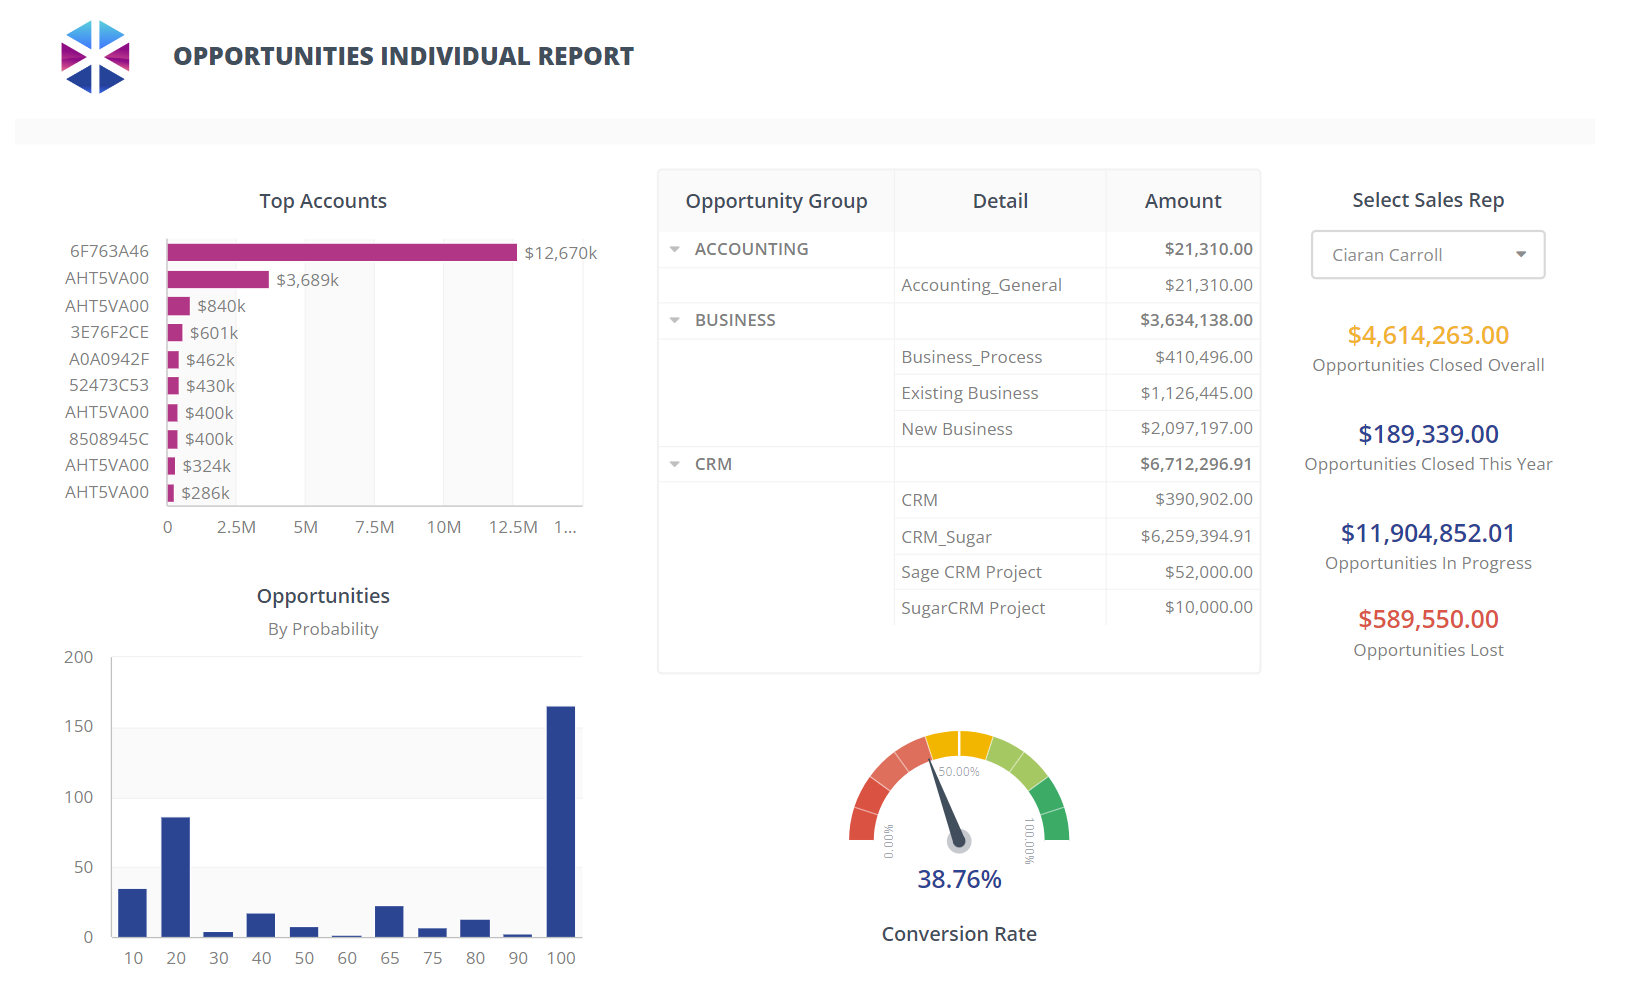
opportunities individual reports
Sales Team and BDR Reporting.
Turn weekly or monthly reports into hourly reports. Turn manual reports into automated reports. Design custom reports that can be used at every level. Segregate teams by region, product, goal… It’s your sales team, it should be your sales report!
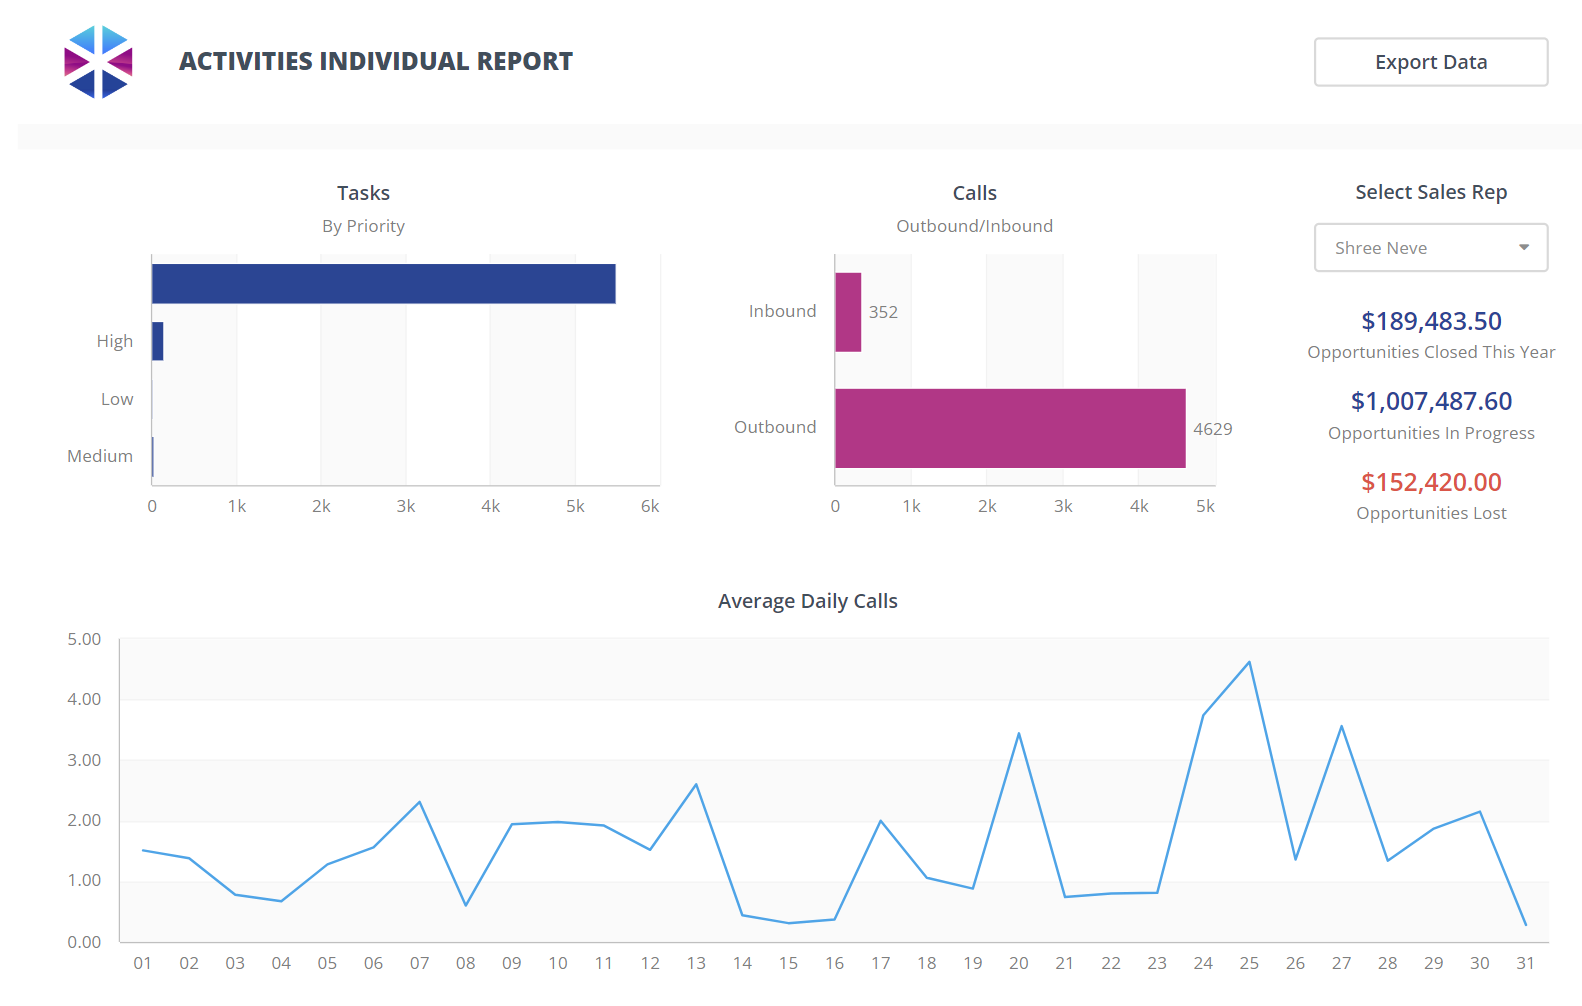
activities individual report
Monitor and Correct in real-time!
Stay on top of what’s key to driving your business. Customer satisfaction, sales appointments, sales cycle, demos, and so much more. Your KPIs are only of value when they are measured and reported on. Real-time updates are easily available and at your fingertips.
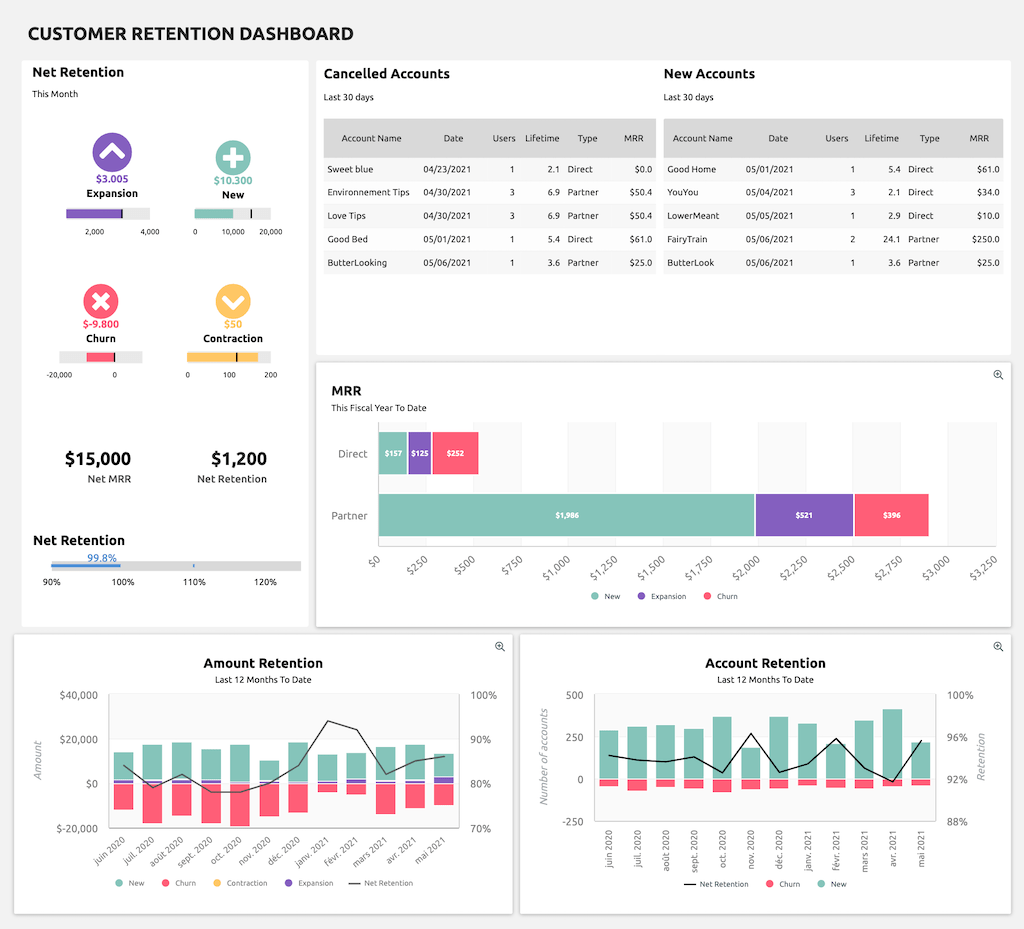
customer retention (mrr and accounts)
In this dashboard, you can analyze your customer retention in value ($) and number of accounts. We monitor KPIs such as New MRR, Contraction MRR, Expansion MRR, Churn. We also look at New and Lost Accounts in the last 30 days.
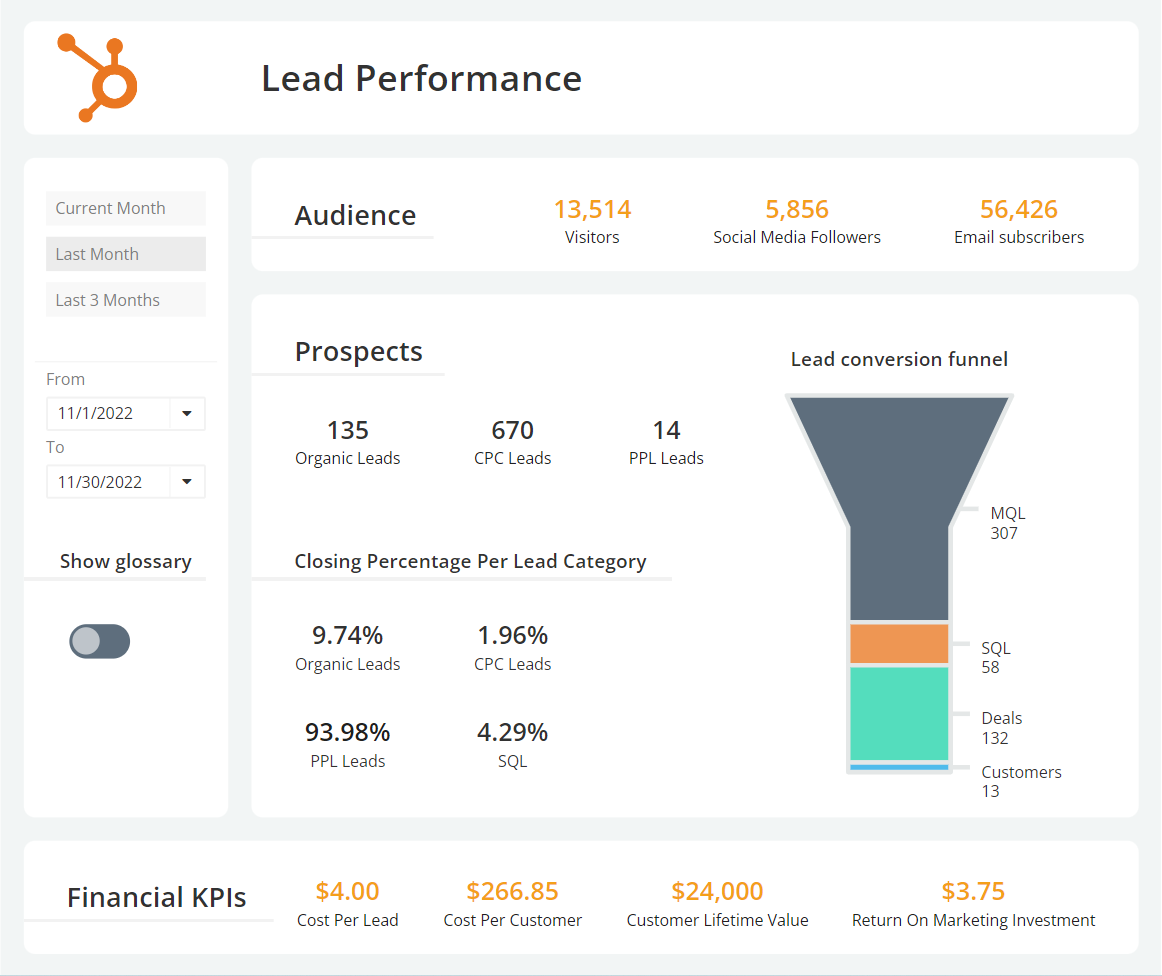
Lead Performance Dashboard
Measure the quality and the value of your organic, PPC, PPL, MQL, SQL leads in a single dashboard. By adding marketing and financial KPIs to your lead performance dashboard, you get the full picture of the performance of your pipeline.
Read our blog post to learn how to build this dashboard.
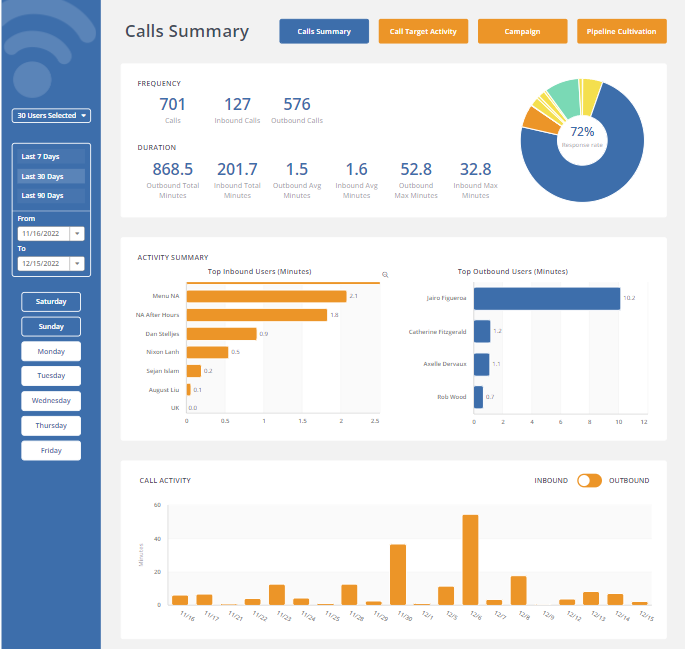
Call Summary report
Track your team's call activity with this summary report.
You have an overview of the call frequency, duration, response rate, and the activity overview per BDR or AM and call type.
This report goes beyond the built-in report in your telephony or VoIP system as it allows you to visualize stats by weekdays, business days, and allows you to drill down into the data.
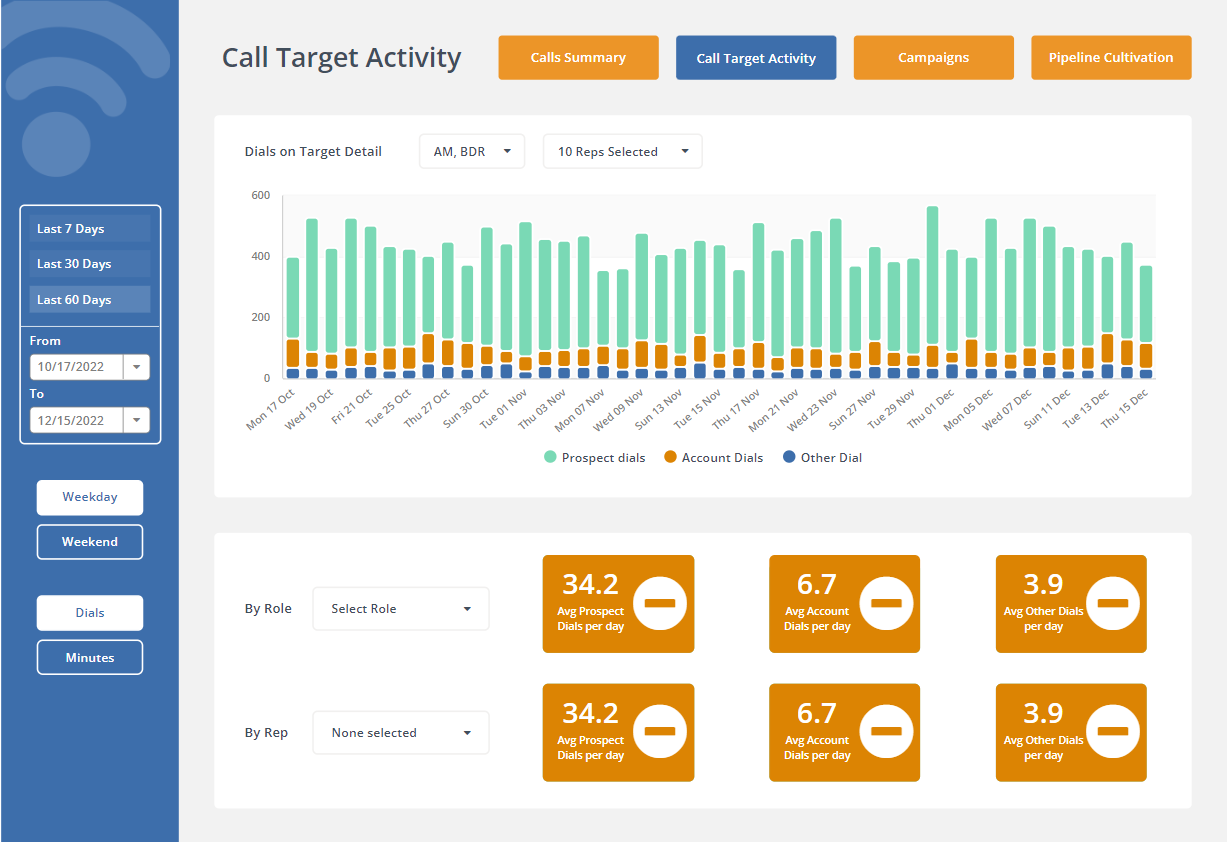
call target activity
In this report, we're looking at individual call activity against the target. You can quickly understand who in your BDR and AM teams is on track and who's behind.
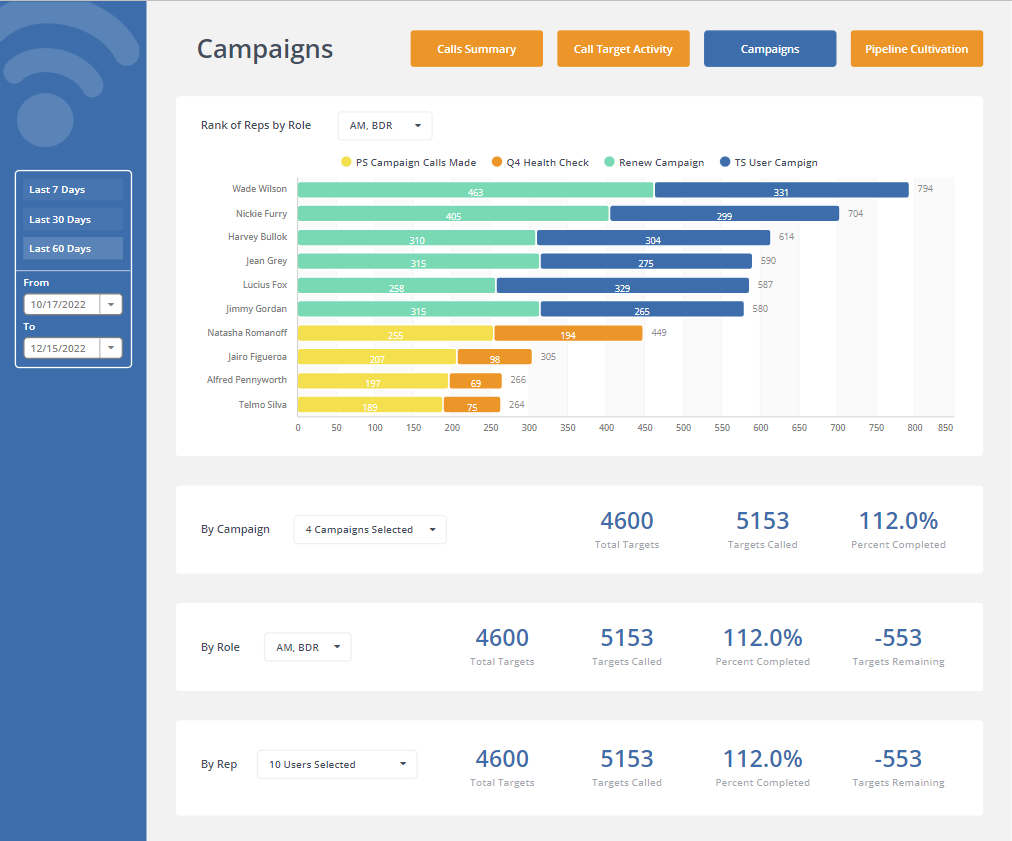
Call activity per campaign
This dashboard is mixing data from telephony or VoIP and CRM systems. It gives you extra insights into your team's call activity.
You can see who's calling per campaign, who's on track, and who's falling behind compared to the team's average activity and to the targets.
pipeline cultivation
This dashboard mixes data from your telephony or VoIP and your CRM systems.
Track your team's call activity per prospect types: MQLs, SQLs, and see how many opportunities are actually being defined and committed per BDR and AM.
This dashboard also shows you the number of dials and call minutes per team and per rep, and the sales rep's rank per quota achieved.

