Understanding your sales pipeline is a fundamental process for business growth. Besides tracking revenue and other apparent success indicators, managing your pipeline accounts for less visible metrics like leads who are stuck in your sales cycle or have fallen off the wagon.
Without a firm understanding of what exactly constitutes growth in your funnel, you can’t accurately forecast sales and the best course of action moving forward.
That’s where tracking your sales pipeline metrics comes in.
Sales pipeline metrics let you review your key performance indicators (KPI), including revenue activity, in terms of pre-defined, long-term objectives. These KPIs, when clearly defined, evaluate your competitive positioning and identify areas for growth.
This article will discuss three main ways to set up KPIs and manage them effectively for growth. Let’s dive in.
3 Steps To Building Your KPIs
Developing your KPIs is a critical strategic planning process for company growth. But you must first define your goals and lay down a strategy to achieve them before doing so. That allows you to see all the data points from an informed angle and measure the few crucial ones that help you understand performance.
Now, let’s discuss how to build KPIs for your sales pipeline metrics below.
1. Identify your data sources
Some metrics are nothing more than supporting characters in a larger objective. Not every metric will qualify as a key performance indicator. You can streamline the data you collect to make informed decisions for a concrete set of objectives with that in mind.
For instance, if your objective is to retain customers, you’ll need data from your CRM software. Standard CRM metrics like upsell rate, sales cycle length, net promoter score, and customer acquisition cost do little for that pre-defined objective.
Instead, you should focus on customer retention cost, churn, and renewal rate to build the KPIs that matter the most.
The same thing applies if you’re measuring sales for a particular quarter. To understand performance, you’ll need the revenue data from your company’s invoicing and accounting software.
Once you understand your sources, you must collect and manage them. That means setting up tools to collect all the data you need from multiple sources and then creating a dashboard that gives you access to your data.
ClicData connects to and extracts data from your CRM, accounts, and invoicing systems, plus over 250 sources into a single data warehouse. That way, you’re able to align all your data sources for everyone on your team.
2. Treat the data to make it usable for analytics
Now that you’ve identified your data sources, you should treat and transform them into visually digestible insights.
This treatment involves data cleansing to detect and remove (or correct) corrupt, duplicate, or inaccurate records from your database. Ideally, the remaining data should support your defined KPIs to a large extent. After which, you merge and unify useful performance indicators to create a cohesive data outlook on your dashboard.
ClicData’s user-interactive dashboard gives you the freedom to combine multiple data sources to build custom KPIs and tailor your reporting to make data-informed decisions.
3. Visualize and share your KPIs
It’s imperative that everyone in your company understands your goals and how you’re tracking your progress toward them. That is especially crucial for leaders and stakeholders and as important for everybody at all levels in the company.
Why? KPIs should be a part of everyone’s decision-making process. Visualizing and sharing your KPIs ensures every employee sees how different department objectives impact the company’s overall KPIs.
KPI visualizations are only effective when you show patterns and variations in a way that engages the viewer. You must ensure the data is unambiguous, accessible, and actionable by using interactive visualization widgets such as maps, tables, and charts.

That way, you’re able to keep leaders and team members invested in succeeding and improving existing KPIs for long-term goals.
5 KPIs To Manage Your Pipeline Better
An accurate and effective sales pipeline cuts across various departments and covers every stage of the marketing funnel – from customer acquisition to lead conversion and after-sales.
That’s why managing your sales pipeline is crucial. You may get fresh insights into your sales process, improve your funnel, and maximize resources by analyzing what happens at each stage of your pipeline.
Here are five Key Performance Indicators (KPIs) to monitor as your business expands.
1. Conversion Rate
The conversion rate is a vital sales pipeline metric that analyzes the effectiveness of your pipeline. It essentially tells you how (and where) you’re converting leads into opportunities and where you’re losing them.
Let’s put this into context.

Your customer passes through different stages of the pipeline before becoming a customer. While these stages vary from business to business, it has four distinct stages regardless of the product offering.
The different stages include:
- Lead Generation: This stage drives people to your site and consistently builds their interest in your offering.
- Lead Qualification: This stage checks whether your generated leads have a buying intent and fit the buyer’s persona.
- Proposal or Quote: This involves delivering a custom quote or pricing to the qualified lead.
- Sale: Here, the lead turns into a customer.
The sales pipeline conversion rate calculates the number of leads that move from one stage to the next with this formula:

Your chances of landing a transaction or closing a sale increase as your leads progress through the sales pipeline. You can use the sales pipeline conversion rate to measure the efficacy of various sales and marketing campaigns.
But keep in mind that conversion rate as a KPI relies on the context in which you’re tracking. For instance, a 2.5% conversion rate might be excellent for email marketing campaigns but might be too low for social media marketing campaigns.
Nevertheless, managing this sales pipeline metric will enable you to identify stages with slow sales processes that might result in leaked leads from the pipeline.
2. Length of your Sales Cycle
If pipeline conversion rates show how prospective leads flow through the pipeline to become customers, then your sales cycle length estimates how long it takes.
This KPI helps you make accurate revenue forecasts, allowing you to gauge your company’s financial health and make informed decisions. Many factors can affect the length of your sales cycle. Apart from industry benchmarks, the products or services you offer will more or less determine the actual length of your sales cycle.
According to Marketing Charts, the sales cycle of B2B businesses can take anything from one month to a year.

Source: Marketing Charts
Your average sales cycle length can help you determine why certain products have a higher conversion rate and what individual salespeople can do to make various pipeline points more effective.
Here’s how to measure your average sales cycle:

For practicality, below is how you can apply this in the real world:

Following this application, your average sales cycle length is 19.33 days. You may use this metric to forecast your next sale or compare it against industry standards to evaluate and maximize your sales cycle efficiency.
3. Customer Turnover
When you’re not retaining customers, you’re losing them. That’s a customer turnover or customer churn rate.
Customer turnover rate or churn rate is a valuable sales pipeline metric to manage when customers pay you at regular intervals, such as in a subscription model. For mobile apps or SaaS businesses, this would mean customers who cancel subscriptions. But for eCommerce businesses, it could mean customers who fail to make another purchase within an established time frame.
Since the customer turnover rate only considers paying customers, it excludes customers at the trial stage to get an overview of customers lost at a specific period, thus making the churn rate the inverse of customer retention.
So, how do you calculate customer turnover in your pipeline?
Start by dividing the total number of customers lost over a specific period by the total customers gotten at the beginning of the same period, then multiply by 100.
For example, if you lost 100 customers in January, but had 3,000 (paying) customers at the start of January, then you should calculate customer turnover as follows:
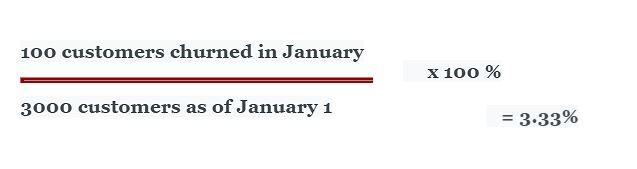
Alternatively, you can also track customer turnover by cohort. A cohort is a group of people who signed up for your services at the same time. It uses a similar formula — total customers lost from cohort divided by total customers in cohort, multiplied by 100.
The cohort churn rate allows you to observe how long customers use your product before abandoning it.
Therefore, if your customer turnover is high or customers are dumping your products after a short time, then your customer service or products may be unsatisfactory. According to Zendesk, poor customer experience could cause 80% of customers to abandon a brand.
But by measuring this sales pipeline metric, you’re able to predict future earnings and identify customer churn patterns that are detrimental to your business.
4. Ratio of Sales to Support
A robust sales process requires team effort. Not just with sales professionals, but management and support staff, too. Though some reports might argue that the ideal ratio for maximum efficiency is 5:1, the truth is, there is no hard and fast rule to it.
You might have to consider other factors like time, industry, and customer service. But more than anything, your product type will determine the kind of support and ratio of sales to support your company must implement.
Managing this metric will identify the products that customers need more support to handle or which takes up more time and attention from support staff.
If your products are too difficult to use or have poor documentation, you might need more support staff. On the flip side, if it is user-friendly, you should have more sales reps than sales support staff. You need to get all customer-facing departments on the same page to hit the sweet spot of this composition and maximize your company’s efficiency.
You need to integrate different strategies to capture a share of the market. Sales automation software will automate your sales outreach and improve overall sales efficiency. On the other hand, an effective email outreach campaign will make subsequent product sales easier. If the product becomes too technical for users, your customer service becomes a good support system for your sales support staff.
5. Profitability
What’s a business without profit? It’s easy to compare current profit with the one from previous accounting periods to gauge your business growth.
However, if you want to monitor your company’s financial health, you’ll need to keep a pulse on your net profit and net profit margin. Net profit is the amount of money left after deducting interest, operating, and tax expenses, and net profit margin is the percentage of your revenue, that is, profit.
This metric is quite different from the gross profit that helps you identify ways to minimize the cost of goods sold or raise product prices. The net profit as a KPI shows you profit, and the net profit margin shows you profitability.
The formula for calculating net profit is simple. First, add your total expenses (i.e., operating expenses, including taxes and interest). Then, minus that figure from total revenue.
That is your net profit.

Although there isn’t an exact number for a healthy net profit, you’ll want to avoid a net loss, as this will mean your costs are too high. To mitigate this, track every expense to identify areas where you can save money without jeopardizing the company’s operations or efficiency.
Moving forward, if you want to measure your business’ profitability, then track the net profit margin using this simple formula:

The net profit and net profit margin metric make it easier to know which deals or opportunities are profitable and make the most revenue. That, in turn, allows you to make intelligent choices when assessing what deals to assign to a pipeline or what product or services to upsell.
Design Your Metrics According to Your Business Needs
There isn’t a one-size-fits-all process for all industries when it comes to measuring your company’s success and growth. You’ll have to build your own sales pipeline metrics depending on your company’s goal and objectives and transform this raw data into visually appealing information for everyone in your organization.
Nevertheless, the sales pipeline metrics discussed above are dynamic measurements to monitor your sales pipeline. You’ll need to keep refining specific metrics as you optimize your pipeline or replace them with other indicators of success that align with your objectives at certain times.
While managing these KPIs can impact your business positively, it takes a bit of time and effort. With consistent practice, you’ll gain better visibility into performance and make better decisions that will tow your business on the right path.
About the author
Matt Diggity is a search engine optimization expert and the founder and CEO of Diggity Marketing, The Search Initiative, Authority Builders, and LeadSpring LLC. He is also the host of the Chiang Mai SEO Conference.
Helping thousands of data-driven companies
Every day we publish thousands of dashboards, process billions of rows, store terabytes of data for companies just like yours.
